Energy Consumption Monitoring System for Buildings in Shanghai GM Cadillac
The project is located in Pudong, Shanghai. The system is built for real-time online monitoring of electricity, industrial water, cold water, hot water, natural gas, compressed air and so on in paint workshop, metering and analyzing of the above-mentioned energy consumption in accordance with the production line and process, production team and use, to achieve energy consumption assessment and refined management.
Project Scope
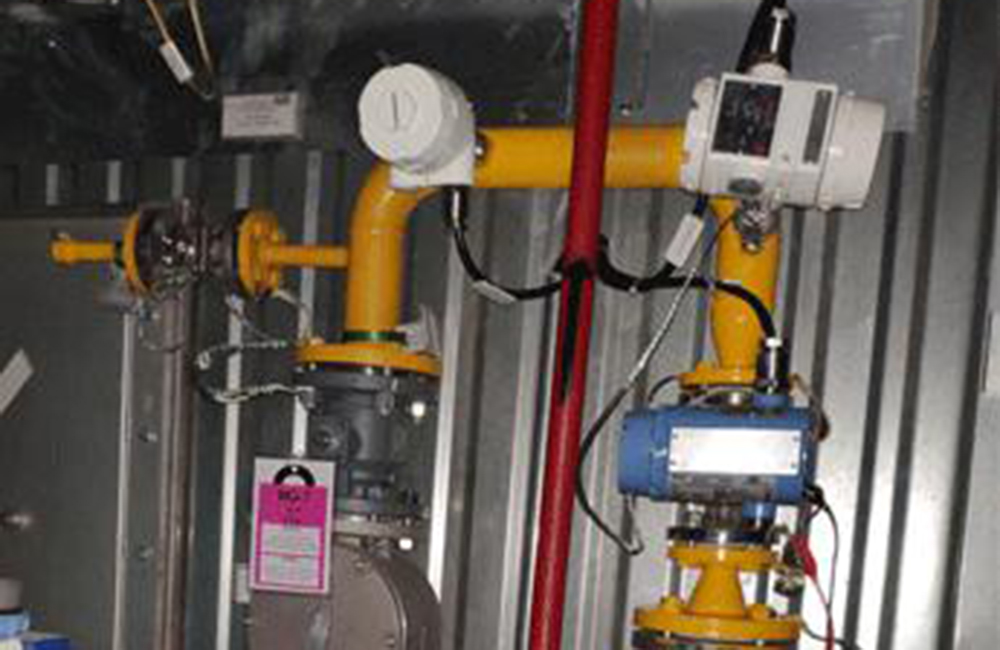
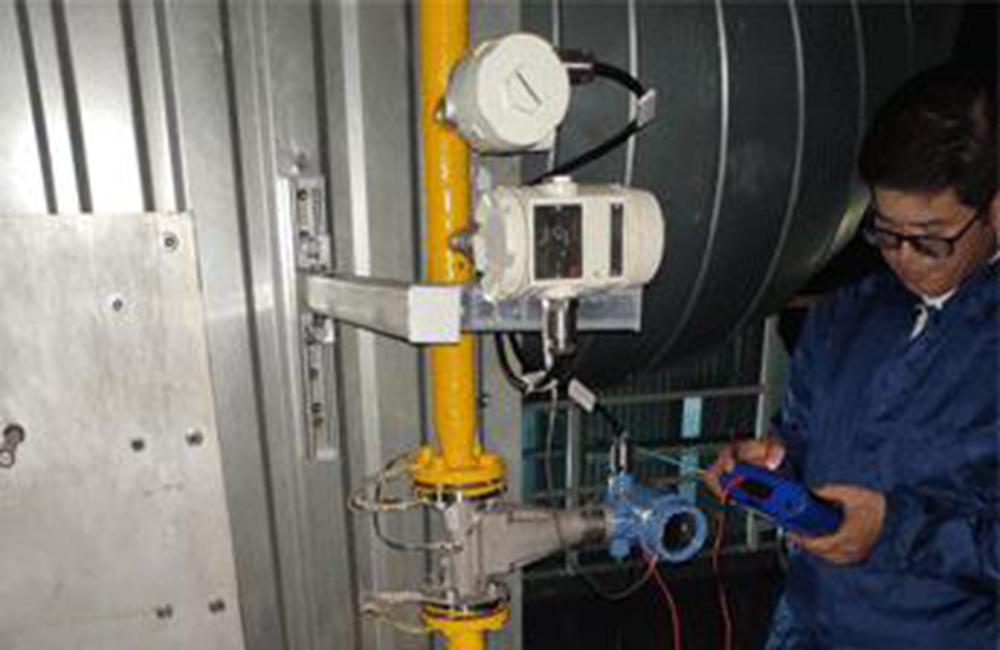
This project involved the installation of Acrel’s multi-function meters, 34 vortex shedding flow-meters (measuring gas meter), 9 heat meters, 30 cold gauges, 14 industrial water meters and 30 vortex shedding flow-meters (measuring compressed air).
Challenge

1.The selection of various meters and the integration of meters and communication;
2. On-site construction and project stakeholders coordination;
3. The installation time of the project is urgent and it requires reasonable and detailed planning;
4. Safety risks of gas pipeline renovation;
5. Customization requirements of system function.
Solution & Result


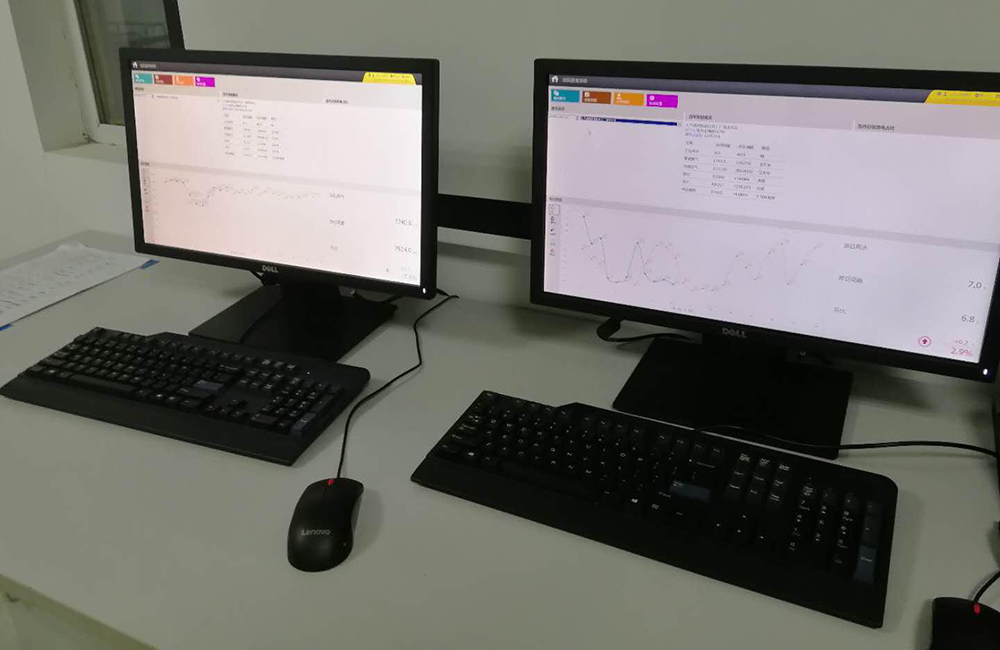
Acrel provides the Acrel-5000 Energy Consumption Monitoring System. The system adopts the ring network structure, at the same time, the dual-machine thermal redundancy design is realized from the acquisition layer, the transmission layer and the management layer, and the data is uploaded to the energy management platform while realizing the internal display of the workshop.
Main functions of the monitoring system:
● Comprehensive Energy Consumption Display: reflecting the classification energy consumption and comprehensive energy consumption conversed to standard coal in the current year.
● Energy Consumption Comparison: reflecting the comparison of energy consumption, growth percentage and added value of a certain classification on the current day,month,year and yesterday, last month, and last year.
● Display: statistics of daily, monthly, weekly, seasonal, and annual energy use of the branch displayed through various charts such as histogram, dotted line diagram, stacked map, and pie chart.